
Once I was asked, “Do you know the peak side-lobe ratio of the frequency response of the rectangular window?”
It was embarrassment for me to reply, “No, I don’t remember.” I was not smart!
A rectangular window is defined as
![\displaystyle h[n] = \left\{\begin{array}{cc} 1/M, & n = 0, 1, \ldots M-1\\ 0, & \text{ otherwise}. \end{array}\right.](https://s0.wp.com/latex.php?latex=%5Cdisplaystyle+h%5Bn%5D+%3D+%5Cleft%5C%7B%5Cbegin%7Barray%7D%7Bcc%7D+1%2FM%2C+%26+n+%3D+0%2C+1%2C+%5Cldots+M-1%5C%5C+0%2C+%26+%5Ctext%7B+otherwise%7D.+%5Cend%7Barray%7D%5Cright.&bg=ffffff&fg=000000&s=0&c=20201002)
and its frequency response is
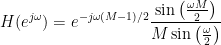
The peak side-lobe ratio depends only on the magnitude response and hence the 


and reaches its minimum at 


The maximum side-lobe amplitude of the magnitude response coincides with the minimum value. Therefore, the peak side-lobe ratio is given by


Now, for large values of 


That’s it! Most of the books and references say 13 dB, perhaps an integer approximation.
The magnitude response of the rectangle window in dB is plotted in Figure 1.

Figure 1: Magnitude Response of Rectangle Window (dB).
Now, how large should 


Figure 2: Convergence of Peak Side-lobe Ratio with respect to the filter length M.

So, as long as the no. of taps is greater than 8, the peak to side lobe ratio is maintained @ 13.5dB. Thanks for sharing. I believed filter of any length had this ratio.
Similarly, for a linear antenna array, the main lobe to sidelobe difference is guaranteed to be 13.5dB only for more than 8 antenna elements. This is where 8 brings better understanding of the mathematical treatment of spatial filter.
LikeLiked by 1 person
Thank you for the comment ARK:)
I don’t know much about antenna arrays but spatial filter is indeed an FIR filter. So, what you said — that if the number of taps is greater than 8, the main lobe to side-lobe difference is 13.5 dB — will be valid when the tap weights are same for every tap. Thus it is a filter with a rectangular window as the impulse response. But this is not in used in practice, no? Usually different weights are used which will improve the main-lobe to side-lobe ratio.
Can you give any antenna theory reference which says that the ratio is 13.5 dB if the number of taps are greater than 8?
LikeLike
very good
LikeLiked by 1 person